TRANSMISSION AND DISTRIBUTION (FACTS & FIGURES)
| (i) Service Delivery at the CEB |
The response time to the requests of customers is a very important aspect of service delivery and requires close monitoring.
|
| (ii) Reliability of Supply |
| The CEB is committed to improving its reliability of supply and preventing power interruptions by the continuous monitoring of its SAIDI and SAIFI indices in line with best international practices. |
| Table 1.0 and 2.0 below provides for SAIDI* ,SAIFI** and CAIDI figures for the past four years. |
Table 1.0 - SAIDI and SAIFI Figures for period 2013 to 2017
| Parameters | Units | Areas | 2013 | 2014 | 2015 | 2016 | 2017 |
| SAIDI * | Hours | North | 2.03 | 2.01 | 1.77 | 2.69 | 2.98 |
| Centre | 3.28 | 2.63 | 3.99 | 2.63 | 2.44 | ||
| South | 4.89 | 4.84 | 3.19 | 4.39 | 2.59 | ||
| SAIFI ** | Index | North | 0.58 | 0.6 | 0.6 | 0.96 | 0.86 |
| Centre | 1.28 | 1.08 | 1.08 | 0.96 | 1.12 | ||
| South | 2.49 | 2.16 | 1.44 | 3.54 | 1.83 |
| * SAIDI is the System Average Interruption Duration Index i.e. the average duration of interruption of electricity experienced by a customer during the year. |
||||||||||||||||||||||||||||||||
| ** SAIFI is System Average Interruption Frequency Index i.e. the average number of times a customer has experienced interruption of electricity during the year. |
||||||||||||||||||||||||||||||||
| Table 2.0 – CAIDI Figures for period 2013 to 2017 | ||||||||||||||||||||||||||||||||
|
||||||||||||||||||||||||||||||||
| Table 3.0 Indices for Port Louis Region only | ||||||||||||||||||||||||||||||||
|
||||||||||||||||||||||||||||||||
(iii) System Losses |
||||||||||||||||||||||||||||||||
| Figures for System Losses. |
| Data | 2010 | 2011 | 2012 | 2013 | 2014 | 2015 | 2016 | 2017 |
| Losses (%) | 8.1 | 7.95 | 7.65 | 7.1 | 6.86 | 6.59 | 6.27 | 6.45 |
Maximum Demand for the period 2004-2015
Maximum Recorded Demand as at date: 491.7 MW (Jan 2019)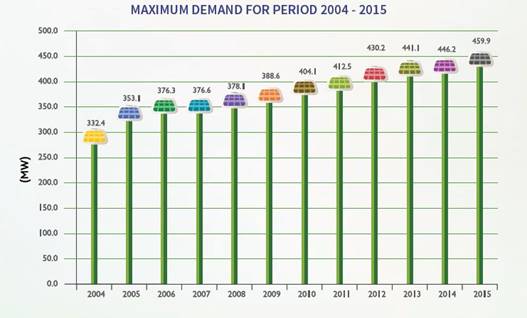
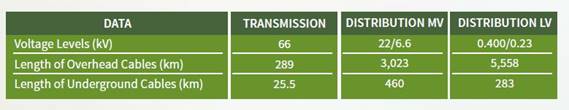
Network Route Length